
If you were involved in digital marketing 10-15 years ago, you’ll likely have gotten fed up with the constant stream of articles titled: “Is this the year of mobile marketing?”
Back then, we all knew mobile was going to be a key channel; we were just waiting for the “killer app” or use case that would make it happen.
Yet, as you can see, interest in the topic “mobile marketing” has dwindled significantly since those heady days:
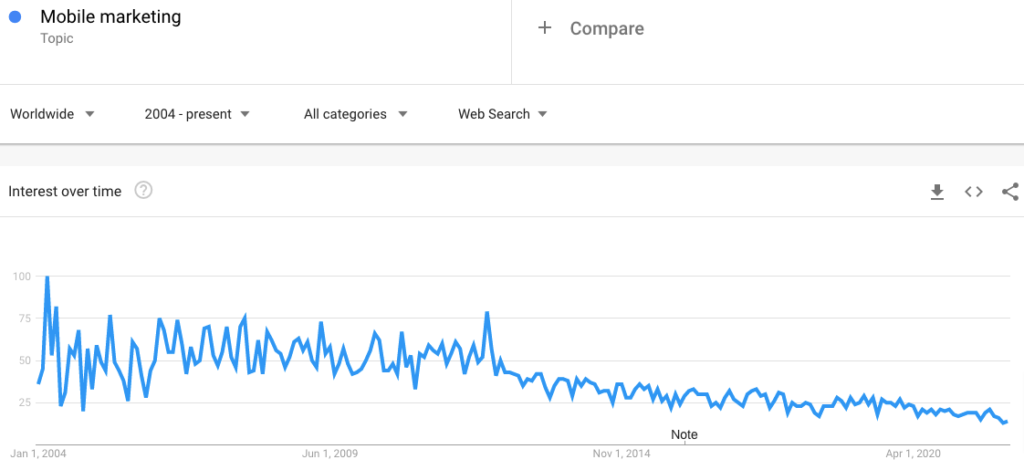
Is that because mobile is no longer relevant or interesting for marketers? In fact, it’s quite the opposite: it’s because today, mobile is so important that it’s simply become impossible to view it as a standalone channel.
More than half of web traffic and two-fifths of email opens stem from mobile devices. That means your search and email marketing strategies must, in a sense, also be “mobile marketing strategies”.
So it pays to keep up with the latest trends in the world of mobile. That’s why I’ve put together this bumper list of 13 key mobile marketing statistics.
13 Key Mobile Marketing Statistics
1. We Spend Over 3 Hours a Day On Our Phones
2. We Check Our Phones 30 Times During Working Hours
3. Younger Gen Zers Use Their Phones “Just to Pass the Time”
4. Mobile Ad Spend Will Surpass Desktop in 2023
5. One in Five Consumers Enjoy Seeing Mobile Ads
6. Consumers Are Most Likely to See Mobile Ads in Gaming Apps
7. The Vast Majority of Facebook Ad Revenues Come From Mobile
8. Mobile Accounts for Two-Thirds of Ecommerce Traffic
9. Mobile Lags Desktop On Conversion Rates
10. Mobile Commerce Will Represent One in 10 Retail Sales By 2025
11. Nearly Half of Consumers Shop More On Mobile Than In-Store
12. Consumers Favor Mobile Devices Over Speaking to Employees When Shopping In-Store
13. Three-Fifths of Shoppers Prefer Brands That Allow Them to Buy On Mobile
1. We Spend Over 3 Hours a Day On Our Phones (Rescue Time)
The world’s first mass-produced mobile phone was the Nokia 1011, released back in November 1992 (just five months after Denmark won the European Football Championship).
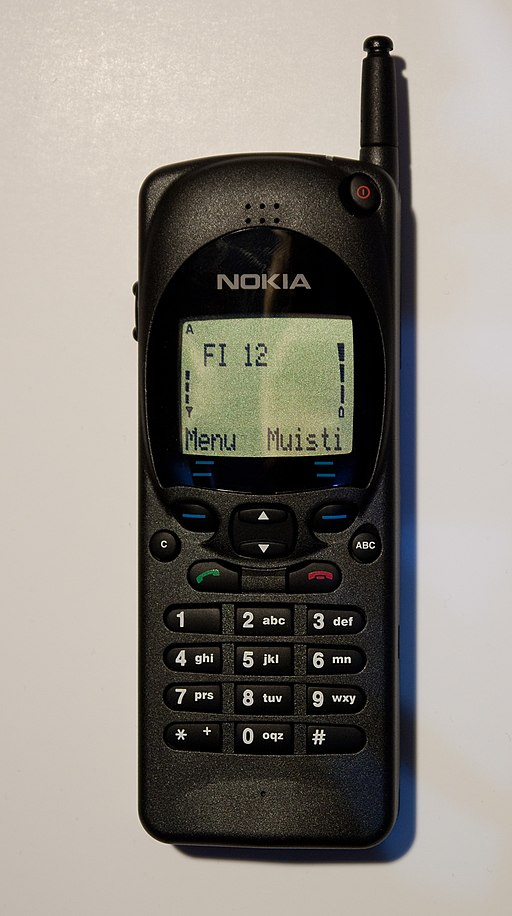
Mustaraamattu, CC BY-SA 3.0, via Wikimedia Commons
Its functionality was pretty basic by today’s standards: you could use it for SMS messaging and calls, and that was it. So unless you needed to make a call or send a text, there was no reason to pick it up.
Things have changed a little since then. According to research from Rescue Time, the average cellphone owner now spends 3 hours, 15 minutes on their phone every day.
That’s more than 71,000 hours a year.
But there’s more—while 3 hours and 15 minutes is the average figure when we slice the data to focus only on the top 20 percent of smartphone users, we can see they’re racking up more than 4.5 hours a day.
To put that in context, the average American is awake for 15.2 hours a day.
So those “super users” are spending almost one-third of their waking time glued to their phones. No wonder mobile is such an attractive channel for marketers.
2. We Check Our Phones 30 Times During Working Hours (Rescue Time)
It seems like we’re addicted to our phones, but how frequently do we pick them up? Do we engage in one massive, three-hour daily screen binge, or do we prefer the little and often approach?
According to Rescue Time, it’s more the latter.
On average, people check their phone a monstrous 58 times a day, with more than half of those instances coming during working hours.
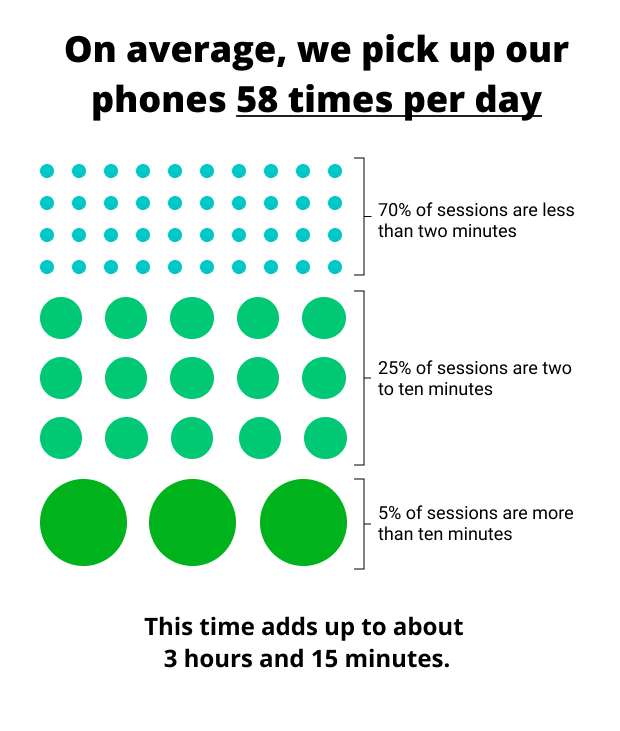
Each session lasts for an average of roughly 1 minute and 15 seconds—just enough to dash off a WhatsApp or two, or watch a handful of TikToks.
All of this means that, as a minimum, we lose about 37 minutes of working time every day to our smartphones.
3. Younger Gen Zers Use Their Phones “Just to Pass the Time” (Pew Research Center)
The conversation about increased “screen time” is often tied to mental health.
There’s lots of evidence to suggest that the longer we spend on our phones each day, the more likely we are to experience negative mental health outcomes like psychological problems, low emotional stability, depression, and anxiety.
Despite—or perhaps because of—this, a high proportion of younger Gen Zs describe using their cell phones as “a way to pass the time”.
According to a Pew Research Center survey conducted in 2018, nine in ten phone users aged 13 to 17 years old said they sometimes or often used their phones in this way.
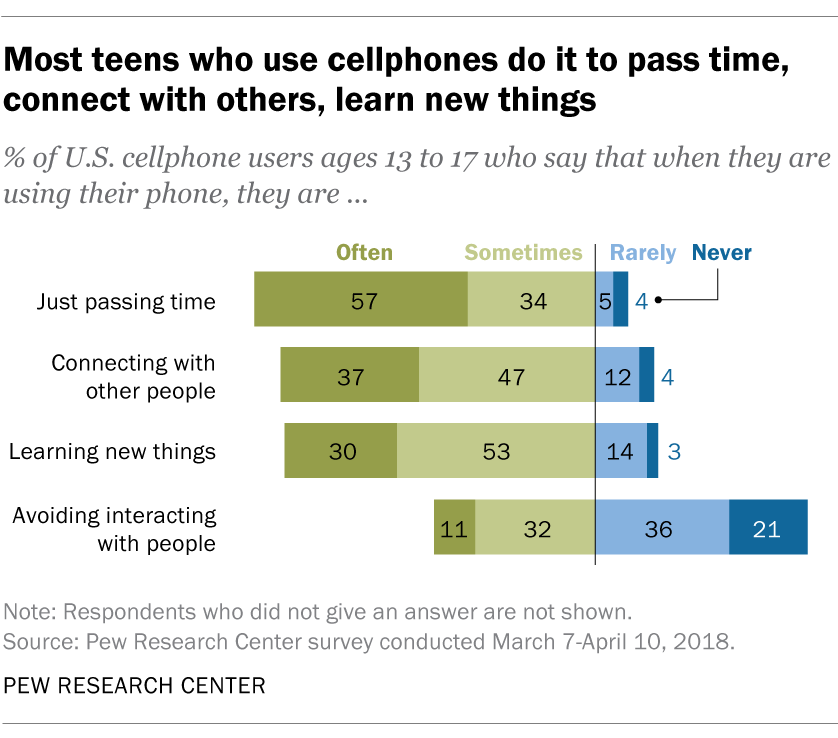
But cell phones aren’t just a hobby or distraction for this demographic.
The same survey found that 84 percent of teen smartphone users at least sometimes use their phones to connect with people, while 83 percent use them to learn new information.
4. Mobile Ad Spend Will Surpass Desktop in 2022 (Statista)
I’ve already pointed out how more than half of internet traffic now originates from mobile phones, so it’s hardly surprising that an increasing amount of ad spend is being targeted at mobile.
For years now, mobile has been chewing up an ever-growing amount of advertising dollars previously directed at desktop users.
But, according to Statista, 2022 is the year mobile will finally take the number one spot with a 51 percent share of ad spending.
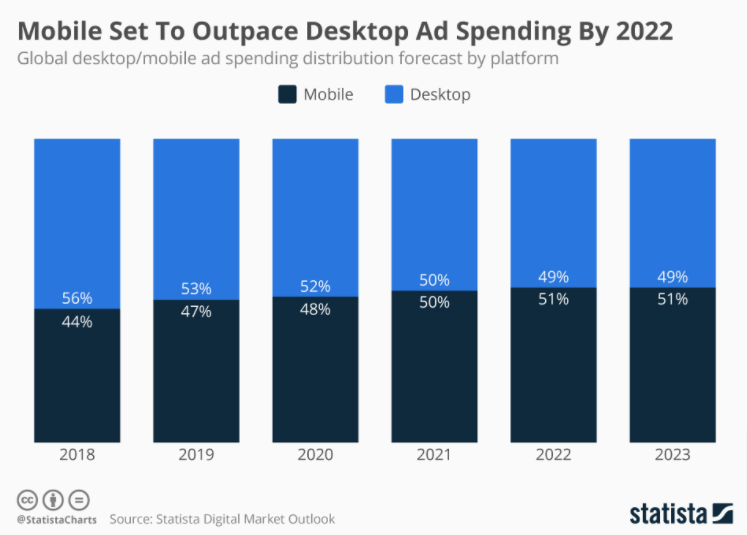
With the rollout of 5G gathering speed, expect mobile to open up more of a lead over the coming years.
5. One in Five Consumers Enjoy Seeing Mobile Ads (InMobi)
What does this increase in mobile ad spend mean for consumers? You might be surprised to learn that one in five of us actually enjoys being served with mobile ads.
It’s worth pointing out that this survey was carried out by InMobi, a mobile advertising technology company, so the findings should probably be taken with a pinch of salt.
But still, it’s interesting to note that the proportion of people who say they enjoy mobile ads jumps to 29 percent among 18 to 34-year-olds.
Which ads do consumers feel most positive about? When asked for their preferences, 18 percent opted for banner ads and the same proportion cited video ads.
Yet those two ad types don’t appear to have the same effectiveness, with 36 percent of respondents saying they notice video ads, and just 25 percent saying they notice banners.
Bizarrely, only 25 percent said they notice interstitials—those really annoying ads that take up the entire screen. (I wish I could stop noticing them too.)
The survey also asked about the actions people take after seeing a mobile ad for a product that interests them, with an impressive one in three consumers choosing to visit the website of the brand or retailer.
6. Consumers Are Most Likely to See Mobile Ads in Gaming Apps (InMobi)
InMobi’s research also looks at the digital “locations” in which consumers are most likely to see mobile ads:
- Gaming apps (25 percent)
- Social apps (23 percent)
- Streaming apps (15 percent)
- Mobile web pages (15 percent)
- News apps (14 percent)
It seems consumers recognize the necessity of ads within gaming apps, with 55 percent agreeing with the statement: “I prefer that mobile apps have ads, rather than having to pay to download apps.”
7. The Vast Majority of Facebook Ad Revenues Come From Mobile (Facebook)
I can’t talk about the growth of mobile ad spending without taking a quick dive into where Facebook’s advertising revenue comes from.
The social media giant’s results for the third quarter of 2019 show that mobile accounted for a whopping 94 percent of all Facebook ad revenues, up from 92 percent a year earlier.
Chances are the proportion is even higher today, but Facebook appears to have stopped disclosing the percentage of ad revenue that stems from mobile.
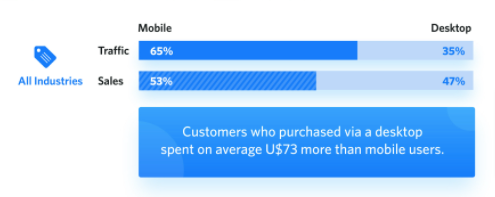
8. Mobile Accounts for Two-Thirds of Ecommerce Traffic (SaleCycle)
We know that mobile now attracts the lion’s share of ad spend. We also know it accounts for over half of web traffic. But what proportion of visitors to ecommerce stores are coming from mobile?
According to SaleCycle, that figure stands at an impressive 65 percent.
However, conversion rate optimization specialists will be startled to learn that all that traffic accounts for just 53 percent of total ecommerce sales. That’s a pretty substantial drop-off, which suggests consumers still have trust issues when it comes to buying on mobile.
Not only that but customers who do make the decision to buy on mobile spend, on average, $73 less per transaction than those who check out on desktop.
9. Mobile Lags Desktop On Conversion Rates (Monetate)
This whole “mobile conversion rate” issue is worthy of further exploration, which brings me nicely to my next mobile marketing statistic.
According to Monetate, mobile shoppers are indeed less likely to convert than their desktop counterparts. But there’s less of a gap than you might imagine.
Monetate’s figures show that the average mobile conversion rate stands at 1.81 percent globally and 1.72 percent in the US.
For desktop, it climbs—but only slightly—to 1.98 percent globally and 1.96 percent in the US.
However, that’s not telling the full story. Intriguingly, consumers are far more likely to add items to cart on mobile than on desktop.
The average global add-to-cart rate on mobile stands at 8.96 percent—more than double the rate on desktop (4.35 percent). And the contrast is even starker in the US (7.88 percent on mobile vs. 3.13 percent on desktop).
What’s going on here? It could be that consumers prefer to start the transaction on mobile and then complete it on desktop.
Or perhaps, for whatever reason, they’re simply more likely to abandon their shopping carts on mobile.
10. Mobile Commerce Will Represent One in 10 Retail Sales By 2025 (Statista)
Shoppers convert at a (fractionally) lower level and spend less per transaction on mobile than desktop. But despite this, by 2025, mobile commerce is expected to account for more than 10 percent of total retail sales in the US—an increase of almost seven percentage points on 2018 levels.
For context, ecommerce as a whole is expected to make up nearly one-quarter of all retail sales by 2025.
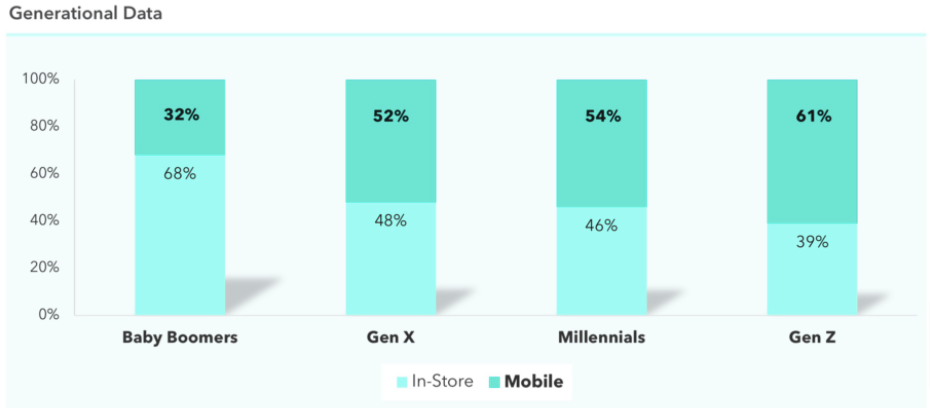
11. Nearly Half of Consumers Shop More On Mobile Than In-Store (Ibotta)
I doubt I’ll surprise anyone when I “reveal” that ecommerce, in all its various guises, has become increasingly popular in recent years.
But did you know that 47 percent of consumers now do more of their shopping via mobile than in brick-and-mortar stores?
According to mobile technology company Ibotta, that proportion is even higher in younger demographics, climbing as high as 61 percent among Gen Z.
By contrast, just 32 percent of Baby Boomers favor mobile over in-store shopping.
12. Consumers Favor Mobile Devices Over Speaking to Employees When Shopping In-Store (RetailMeNot)
Consumers aren’t just doing more of their shopping on mobile—they’re also making greater use of smartphones when visiting brick-and-mortar stores.
According to research from RetailMeNot, 69 percent of in-store shoppers would prefer to search for product reviews on their phone rather than seek assistance from an associate.
I guess that’s unsurprising. We know consumers love reviews, with 89 percent reading them before making a purchase. It stands to reason that if they’re looking for impartial advice, they’d rather turn to the Internet than someone who’s on the store’s payroll.
More surprisingly, 53 percent of shoppers favor searching for deals and promotions on the products they’re planning to purchase rather than asking an in-store associate.
13. Three-Fifths of Shoppers Prefer Brands That Allow Them to Buy On Mobile (Think with Google)
Clearly, a lot of people use their phones to browse, buy, and look for offers and reviews—even when they’re in a physical store.
So it’s no great shock to learn that the option to buy using a smartphone plays a key role in consumer purchase decisions.
According to Think With Google, 59 percent of shoppers say the ability to shop on mobile is “important” when it comes to choosing which brand or retailer to buy from.
Conclusion
Consumers spend a staggering amount of time on their phones. They want to use them to browse your store, access deals, and promotions, and look for product reviews.
And, as we’ve seen, they’re happier to convert on mobile than you might expect.
So whether you believe mobile marketing is a standalone “thing”, or is totally indistinguishable from any other digital channel, it’s clear that mobile has never been more important to ecommerce brands.
And it’s only going to become more important.